


Geratsu was acquired by LiteFinance
We would like to inform you that Geratsu was acquired by LiteFinance, and all its obligations were transferred to the new owner as of 30.07.2023.
LiteFinance makes every effort to make trading in the financial markets as safe as possible for each participant. Therefore, our team has accepted the obligations of the Geratsu broker that ceased its work.
Accounts, balances, open transactions, and trading history of Geratsu clients have been transferred to LiteFinance. The transfer was performed only for those clients who had current open trades and/or any funds on the balances of trading and affiliate accounts.
Go to LiteFinanceWhat does this mean for the clients?
- A client profile and trading accounts with the closest conditions have been opened at LiteFinance for each active Geratsu Client.
- All access details have been sent to Client's email specified when registering with Geratsu.
- Account balances, open transactions, and all trading history have been transferred to your LiteFinance accounts.
- Further processing of orders becomes the obligation of LiteFinance.
- LiteFinance will also perform the processing of withdrawals and deposits.
- Affiliate accounts, if they have funds, have also been transferred, and affiliate networks will be preserved.
Please note: If you already had a LiteFinance profile registered with the same email address used with Geratsu, the new accounts were added to the existing client profile. If you were not a LiteFinance client before, a new client profile was created for you. Please check your email address to get your new access information.
Any questions left?
If you have any questions considering your access details, contact the LiteFinance support service.
Contact supportYou have got the opportunity to continue trading safely with the professional and reliable ECN broker LiteFinance.
Briefly about LiteFinance
Since 2005, LiteFinance ECN broker has been providing its clients access to the most liquid assets, commodities, stock CFDs of the world's largest companies, stock indices.

LiteFinance is a high-tech, reliable ECN broker with a proven reputation. LiteFinance clients can access a convenient and secure online platform with a user-friendly interface and built-in indicators supported in 23 languages. Clients can also use the LiteFinance mobile application, which has the same functionality as the desktop version.
Learn moreLatest LiteFinance awards and achievements
Gazet International
Best ECN Broker of the year in the Middle East
Global Brands Magazine
Most Innovative Regional FX Broker in Asia
Smart Vision Investment Expo
Best Retail Forex Broker
Global Brands Magazine
Best Forex Trading Tools & Software
Smart Vision Investment
Best Mobile Trading Platform
JFEX Award
Best Forex Social Trading Broker
What should I read next?
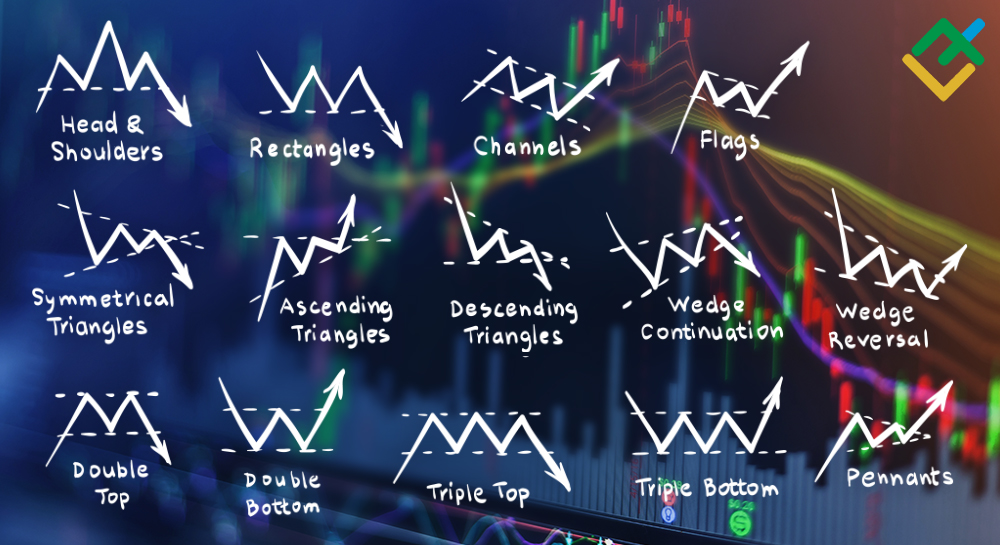
Most efficient Forex patterns: a complete guide
A professional trader talks about the best forex patterns. A complete analysis and application examples.

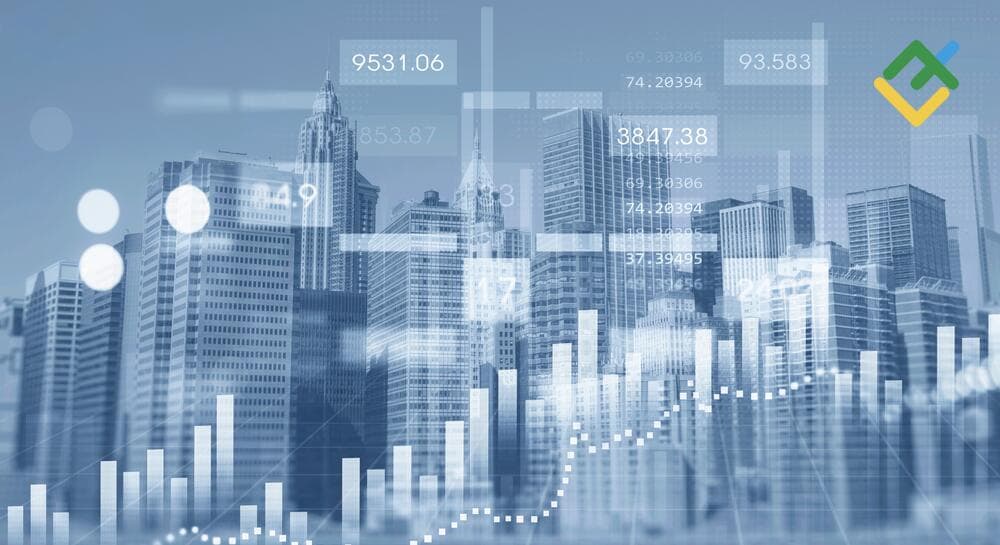
The structure of the financial market and its functions
When reading about financial markets, do you know what you are actually dealing with? Banks, insurance funds, pension funds - the list of structures that make up the financial market is long enough. For a better understanding of its architecture and role, you'll need this article.

Forex Broker Types. A-Book and B-Book
Types of brokers and order execution models. The scheme of sending client’s orders to the interbank market

Forex Simulator for Testing Trading Strategies
Forex Tester (Forex Simulator) is a simple piece of software for testing strategies
Divergence Forex: What is Divergence Trading and How Does it Work
A detailed description of the term, examples of indicators, and profitable trading strategies.
Stock Trading: A Guide for Beginners
All about trading in the stock market. The principles of the exchange operation, strategies, and trading rules.

Gold trading in 2024: how to choose the best strategy for beginners
How to trade gold efficiently without risk – ultimate guide for beginners. Strategies for Gold trading in Forex, gold futures trading. Factors affecting gold price.

What Is MetaTrader? Learn How to Use This Online Platform in Trading
An ultimate user guide to MetaTrader: overview, installation, best indicators, and secret functions.
Fundamental Analysis in Forex Trading
Secrets of using fundamental analysis in Forex and the stock market.

What is Forex: FX Trading Basics
Answering the most relevant questions about Forex and Forex trading.

Forex Spread: Explanation & Examples
Spread explained: calculation formula and types of spread. How to trade with spread.

Forex charts: Ultimate Guide for Beginners
What is the Forex price chart? What chart types are used for trading? Why do traders prefer a particular type of Forex chart? How does trading strategy depend on a certain type of Forex chart?

Best Forex Trading Strategies in 2024 - 2025
A review of the best Forex trading strategies. Advantages, risks, examples.
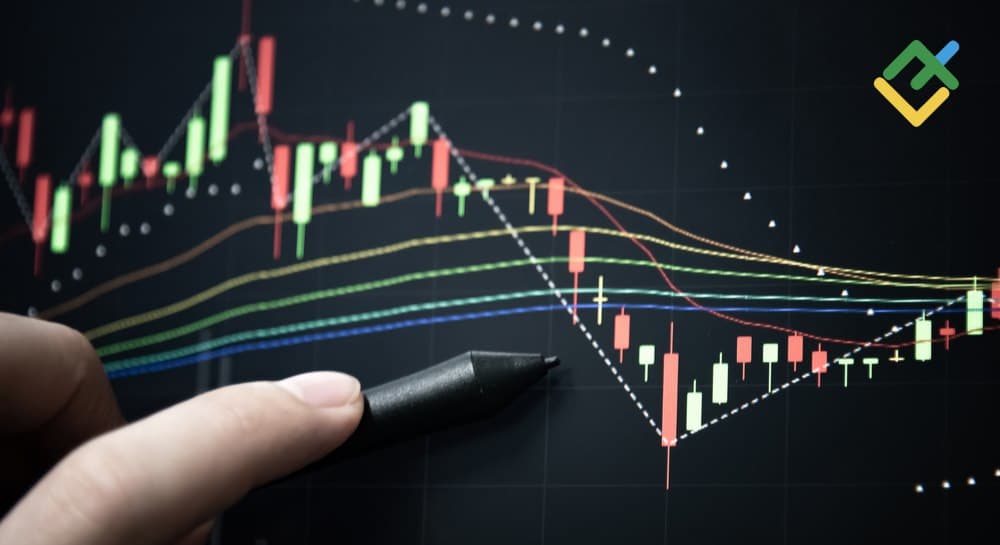
Technical market analysis for beginners: basics, methods, principles
Technical analysis of financial markets. How to start? The answer is in the article.

Silver trading in 2024 - how to choose the best strategy for beginners
All about effective silver trading on Forex. Features, advantages and disadvantages.

Orders: Market, Limit, Stop, Buy and Sell in Forex
Description of all types of orders and examples of their use in trading.

What is the Market Trend? All About How to Find Stock Market Trends
How to analyze market trends and predict price movements. Everything about the Forex trend.

What is a stock index and how to trade Indices
All about Forex stock indices. Definition, methods of calculation, and trading.
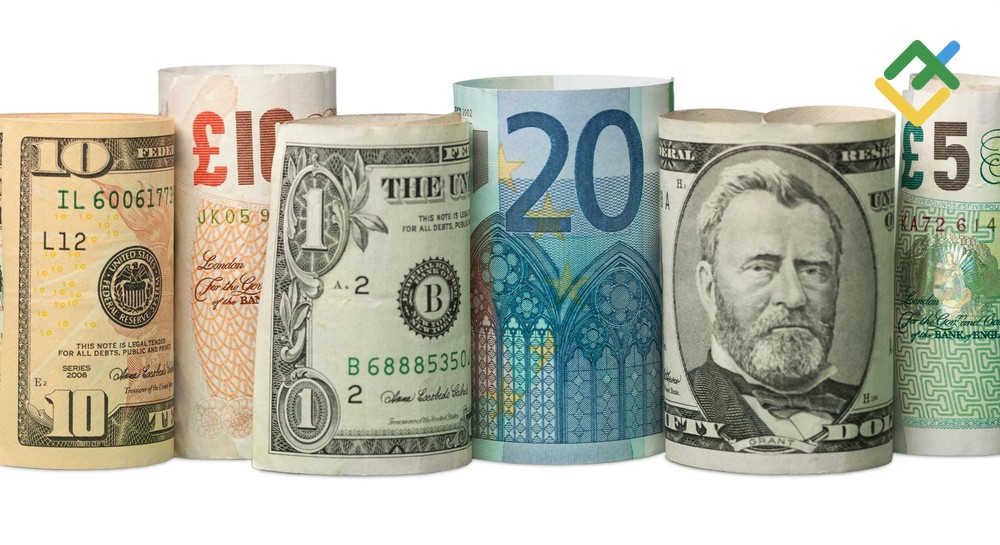
How to trade currency — trade currency guide
Currency pairs on Forex. How to trade currencies in financial markets with minimal risk.

How to trade crypto
How to trade cryptocurrencies at a profit: tips and the best strategies for beginners.
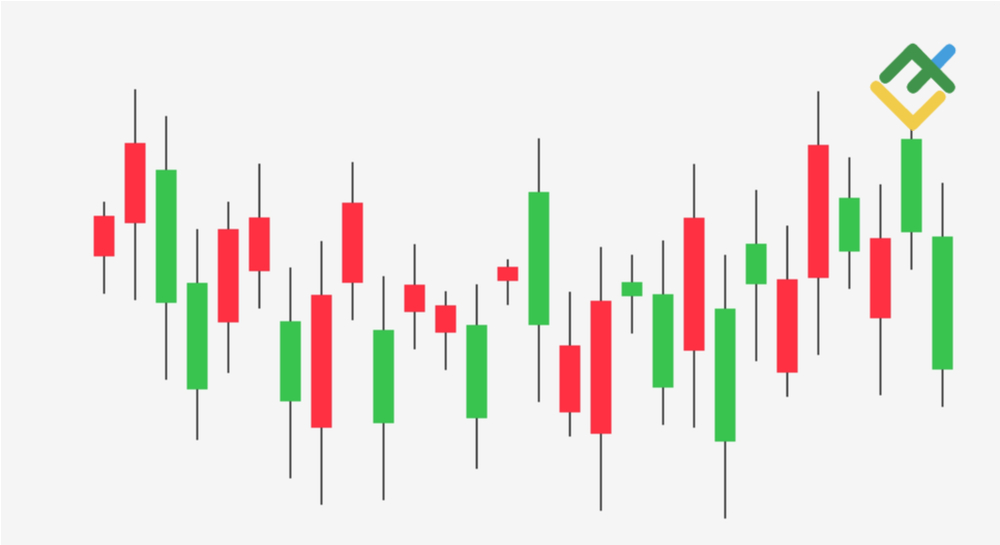
How to Read Candlestick Charts?
A complete guide to candlestick charts in Forex. Types of candlestick patterns with trading examples.
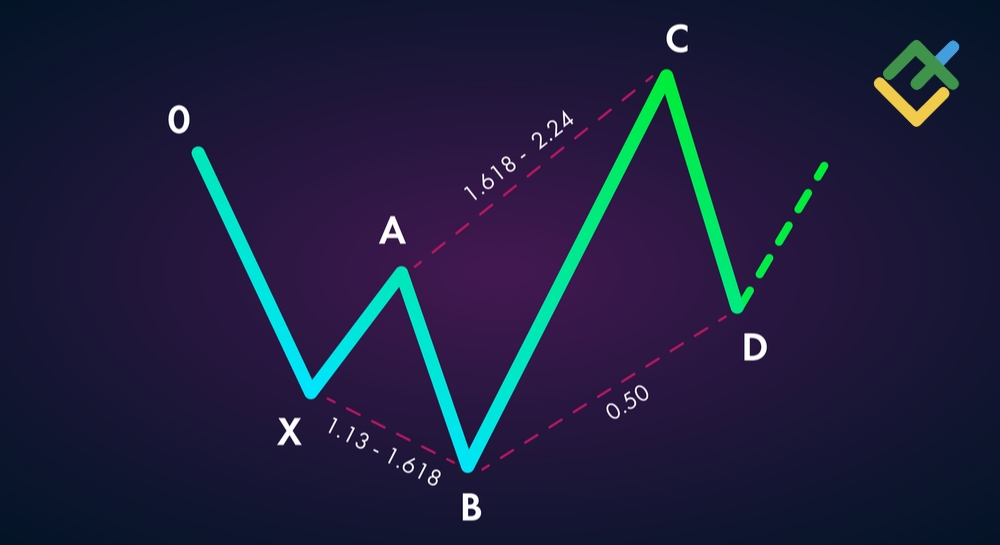
What are harmonic patterns and how to use them for effective forex trading?
Analysis of harmonic patterns including shark, butterfly, gartley, crab, bat and others.

Top 10 Forex Robots for Automated Trading
The best robots for automated trading. Features, advantages, and application in Forex.

Forex Risk Management Guide for Mature and Beginner Traders
Everything about risk management in Forex. Successful risk management strategies.
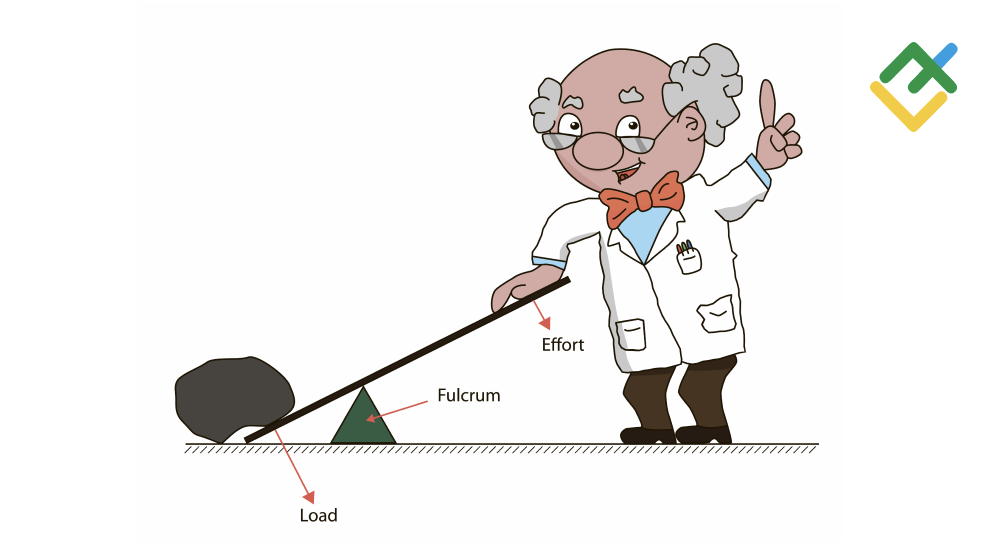
What is Leverage in Trading: Examples and Definition
What is leverage, and how does it work? Read on, and you will learn how to calculate optimal leverage.

Forex account types — difference, which one is better
How to choose the best Forex trading account. Types and differences.
Day trading guide for beginners
Simple day trading strategies for beginners. What assets to use and how to enter trades.

What is CFDs Trading and How They Work
Contracts for difference: definition, pros and cons compared to other trading instruments.
Best Forex Trading Indicators Every Trader Should Use
A beginner's guide to Forex Indicators: The best tools for trading.